
Visual Fraction Models: Definitions and Methods
Visual fraction models use equal-sized parts of shapes, bars, lengths, sets, or number lines to show a fraction's value and make its numerator, denominator, and relationship to one whole visible. Before moving forward, you should understand basic fractions. Using diagrams helps connect abstract numbers to physical sizes.
What are visual fraction models?
A visual fraction model is a graphic representation that divides a specific whole into equal parts. These drawings bridge the gap between numerical fractions and their physical meanings.
Every fraction model contains three critical pieces of information:
- The whole: The complete shape, group, or length representing exactly .
- The denominator: The total number of equal parts that make up the whole.
- The numerator: The specific number of equal parts being shaded, counted, or selected.
Models allow learners to see relationships between different sizes, making it easier to compare values and find equivalents visually.
Area and region models
Area models use a single geometric shape, such as a rectangle, circle, or hexagon, to represent one whole. The shape is divided into smaller, identical regions. The fraction is determined by comparing the shaded area to the total area of the shape.
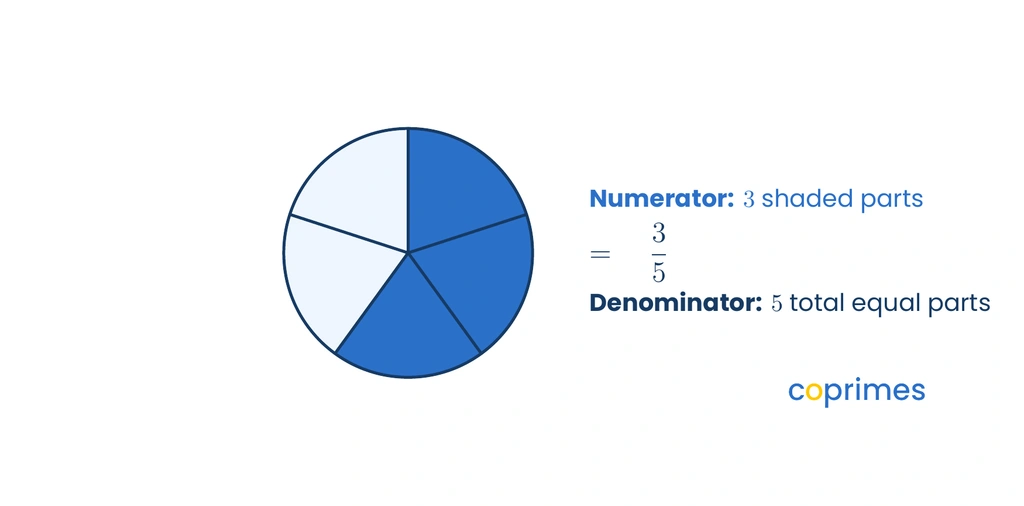
The area model is one of the most common ways to introduce parts of a whole, particularly for visual learners who relate well to shapes.
Fraction strips and bars
Fraction strips, also known as tape diagrams or fraction bars, are long rectangles divided into equal segments. Multiple strips are often stacked vertically, where each strip represents one whole broken into different numbers of parts.
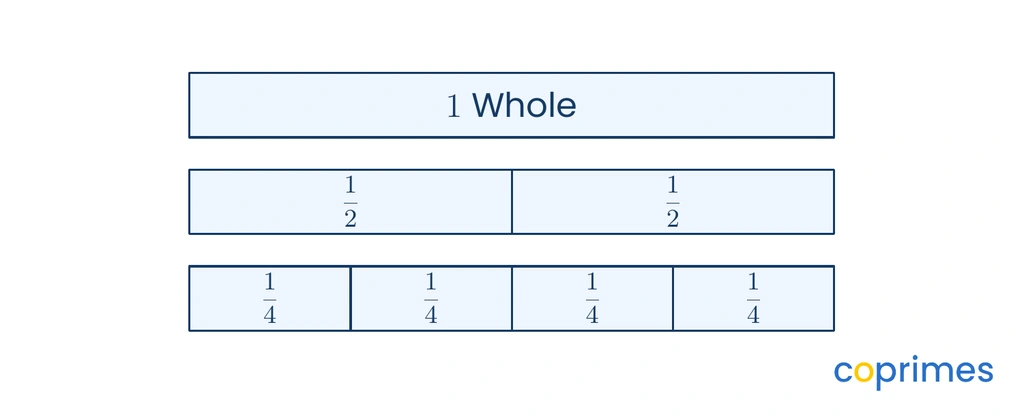
By lining up the edges of the strips, you can instantly see that is exactly the same length as two segments. This makes fraction strips excellent tools for discovering equivalent values and comparing sizes.

Set models
Set models use a collection of distinct, separate objects to represent the whole. In this model, the denominator is the total number of objects in the group, and the numerator is the number of objects that share a specific trait, such as color or shape.
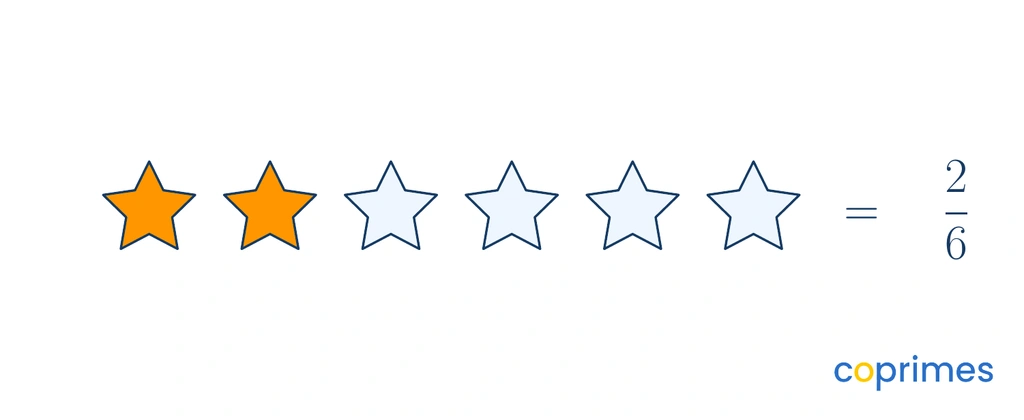
Unlike continuous shapes, groups of distinct items are perfect for understanding fractions of a whole and a set. A common real-world example is identifying the fraction of red apples in a mixed basket of fruit.
Length and number-line models
Length models measure the straight-line distance from zero. A number line represents the whole as the distance between and . The segment is divided into equal intervals based on the denominator.
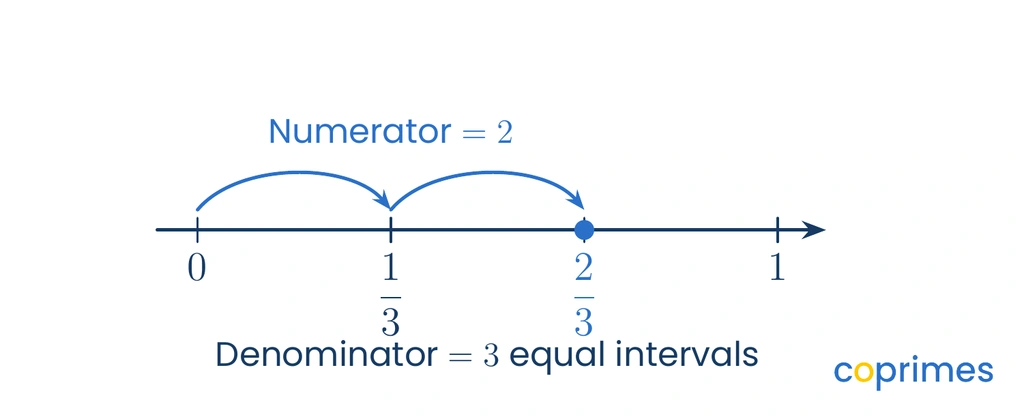
Each interval represents one of the foundational unit fractions, which are combined to reach a specific value. Placing fractions on a number line prepares learners to treat fractions as exact numbers that exist between integers, rather than just pieces of a shape.
Choose the right model
Different tasks require different representations. Selecting the correct model makes solving the problem significantly easier.
Model Type | Best Used For |
Area | Showing parts of a single continuous geometric shape. |
Strips | Comparing lengths and finding equivalencies side-by-side. |
Set | Working with collections of separate objects or counting groups. |
Number Line | Measuring distance, graphing, and visualizing mixed numbers past . |
It is essential to practice with multiple forms. Relying on just one representation can limit a learner's ability to recognize fractional relationships in new contexts.
A learning plan shaped by your child, not the class
State-aligned Math plus our own Logic and English curriculum. An adaptive baseline test finds the gaps and fills them.
Worked examples
Review these examples to see how visual models are constructed and interpreted.
Example 1: Identifying a fraction from an area model
Question: What fraction of the rectangle is shaded?
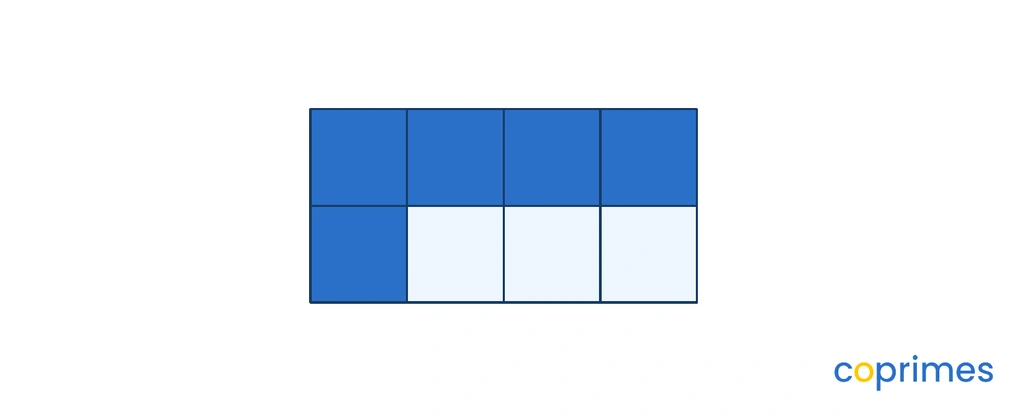
Given: A rectangle partitioned into smaller equal squares, with some squares shaded blue.
Method:
- Count the total number of equal parts to find the denominator. There are equal squares.
- Count the number of shaded parts to find the numerator. There are shaded squares.
- Write the fraction as .
Answer: The shaded fraction is .
Check: The unshaded parts are . The total parts are . This confirms the whole is correctly counted as .
Example 2: Finding a point on a number line
Question: Which fraction is located at point on the number line?
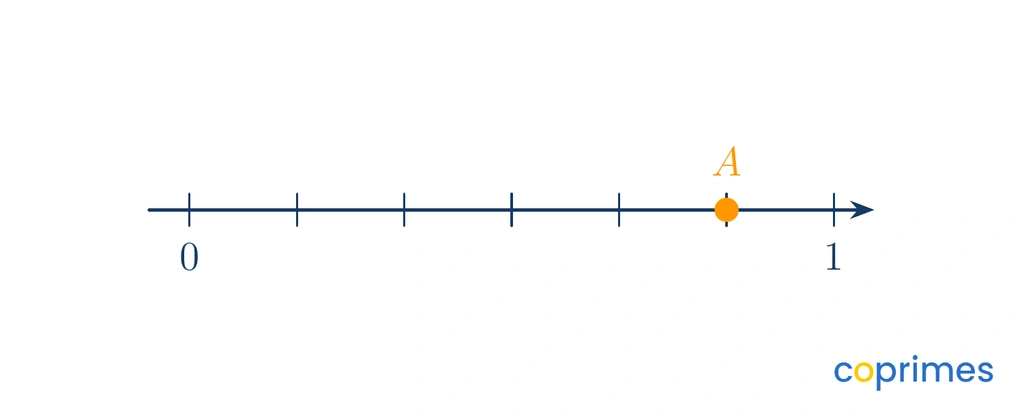
Given: A number line starting at and ending at , with a marked point .
Method:
- Count the number of equal segments between and to find the denominator. There are equal intervals, so the denominator is .
- Count the number of segments from to point to find the numerator. Point is segments away from , so the numerator is .
- Construct the fraction. The position is .
Answer: Point is at .
Check: Point is exactly one segment before . Since , moving one segment backward equals . This confirms the position.
Common mistakes
One of the most frequent errors when drawing or reading visual fraction models is ignoring the rule of equal parts.
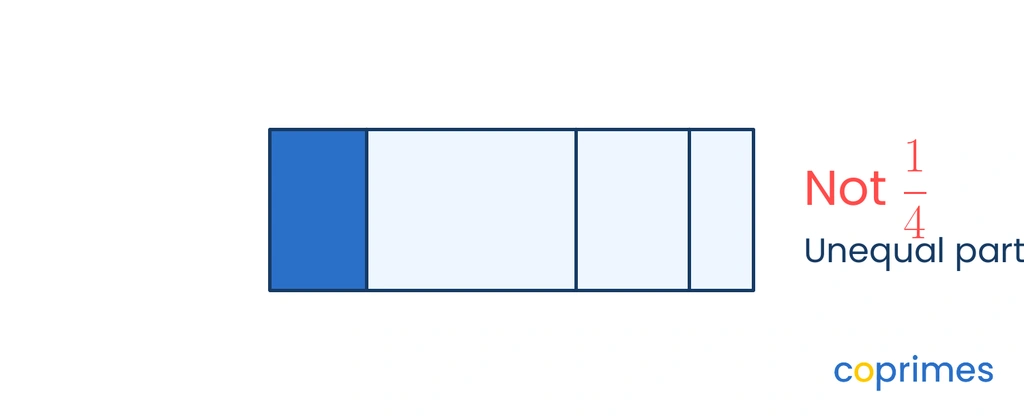
If a shape is split into four parts, but the parts are different sizes, shading one of them does not represent . The denominator only works when every segment, slice, or interval is exactly the same size. Always verify that the divisions are completely uniform before counting.
A fraction model is only valid if the whole is divided into parts of exactly equal size.
Practice questions
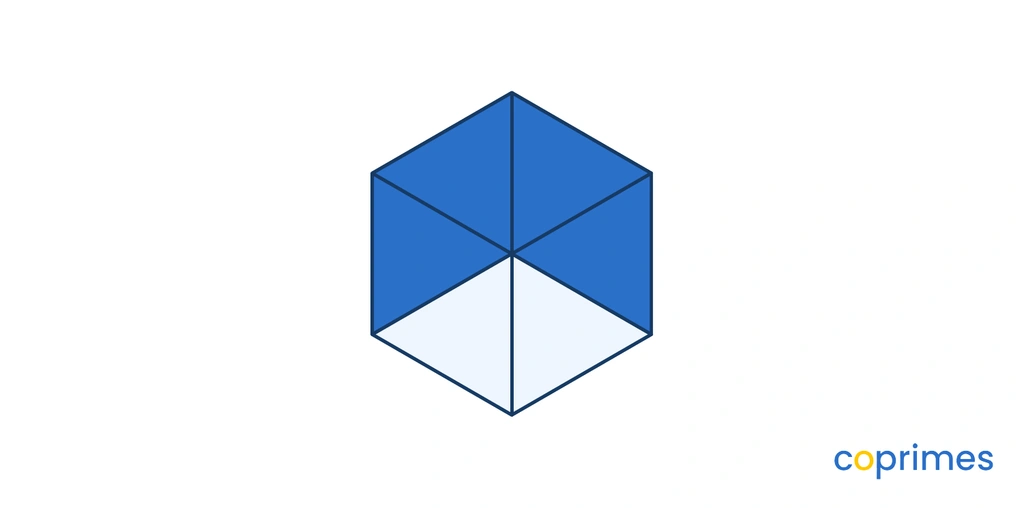
Which fraction is represented by the shaded area of the hexagon?
Which type of visual fraction model represents a single continuous whole divided into identical 2D regions?
A set model using distinct separate items.
An area model using geometric shapes.
A number line model measuring distance.
A whole number representation.
An area model using geometric shapes.
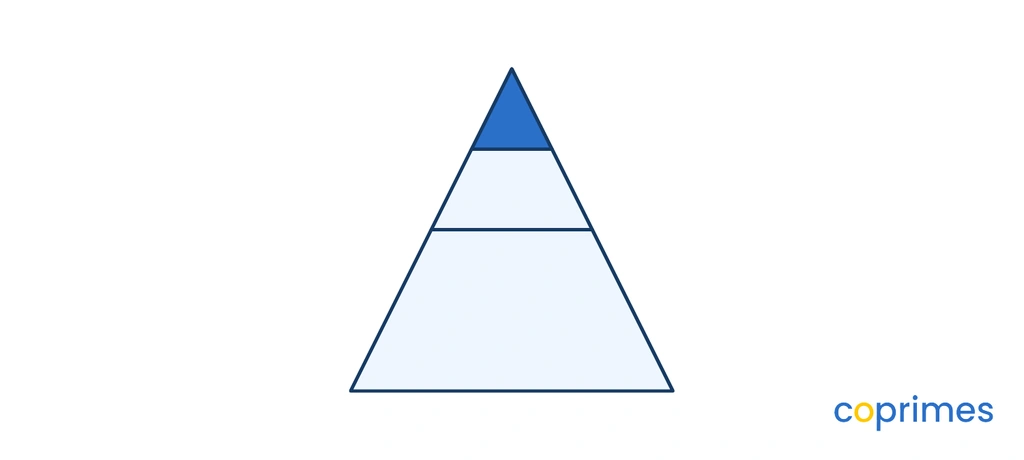
Why does the shaded region not correctly represent of the triangle?
The shape has too many shaded pieces.
A triangle cannot be used as an area model.
The three parts are not exactly equal in size.
The denominator should be the number of unshaded parts.
The three parts are not exactly equal in size.
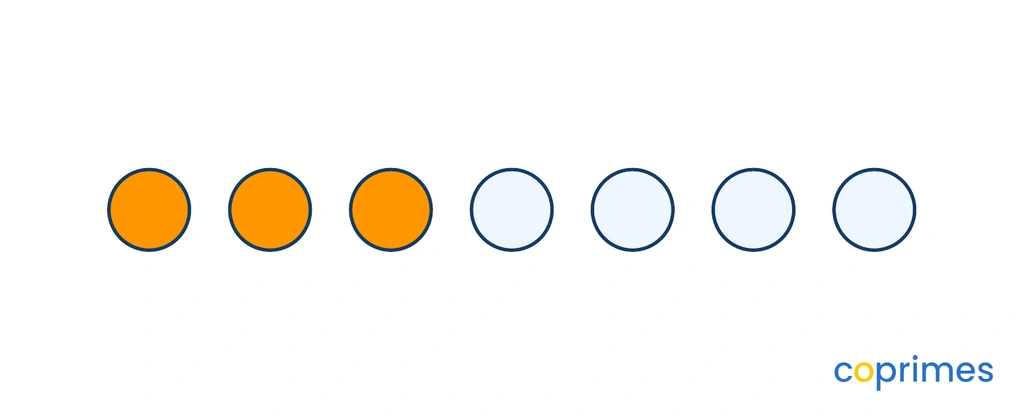
What fraction of the set model is shaded orange?
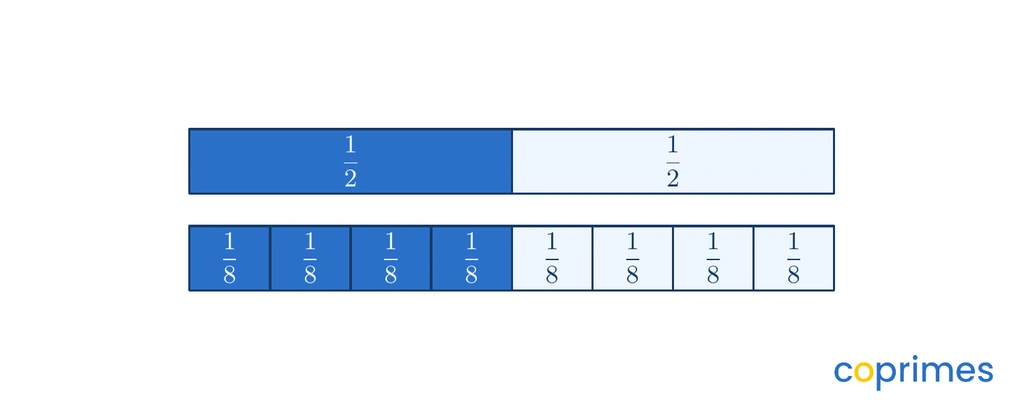
Based on the fraction strips provided, which fraction is visually equivalent to ?