
Bar Models in Math
A bar model represents known and unknown quantities with proportional rectangles so the additive, multiplicative or comparison structure of a word problem becomes visible.
Before learning this visual tool, it is helpful to be comfortable with standard math word problems. You might also hear this method called strip diagrams and tape diagrams, but they all refer to the same mathematical drawing technique.
What is a bar model?
A bar model is a rectangular drawing that shows how numbers in a problem relate to one another.
The length of each rectangular bar is drawn roughly proportional to the value it represents. By mapping out the given numbers and identifying the missing number with a question mark, you can easily see whether you need to add, subtract, multiply, or divide.
Part-part-whole models
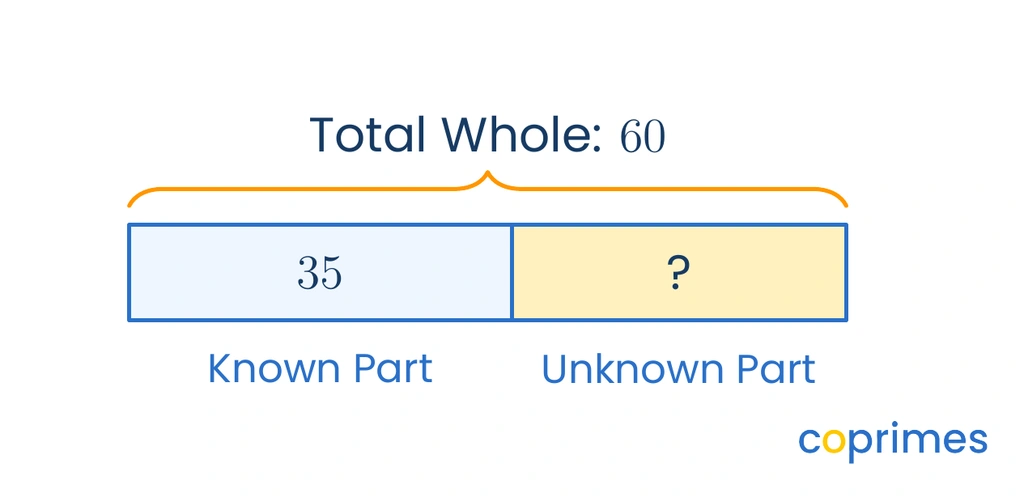
Part-part-whole models show how two or more smaller values combine to create a total.
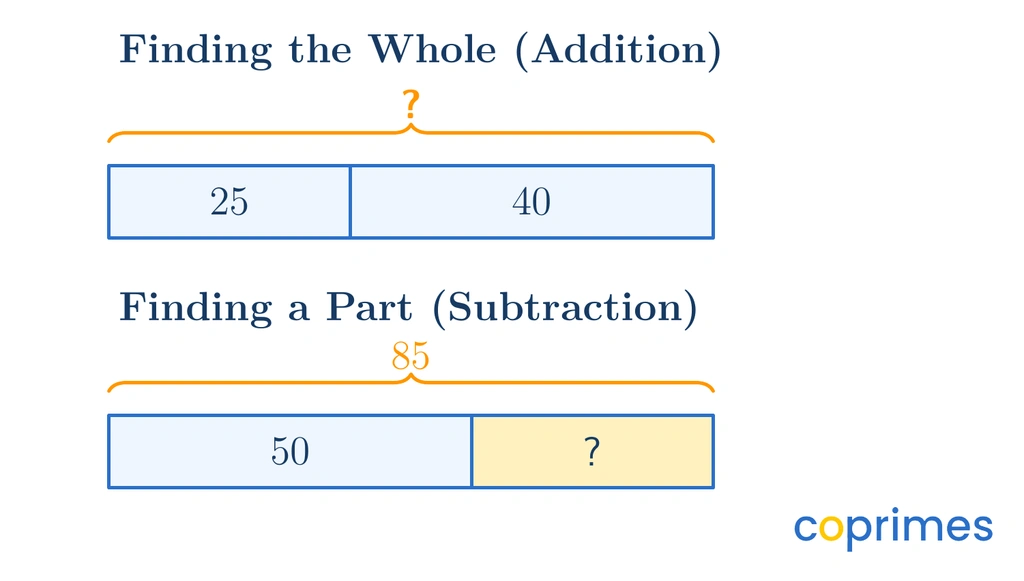
When the whole is unknown, add the parts. When a part is unknown, subtract the known part from the whole.
When the whole total is missing, the diagram groups the known parts beneath an empty total bracket, indicating addition. When the total is known but one part is missing, the diagram shows the known part taking up a portion of the whole, indicating subtraction.
Comparison models
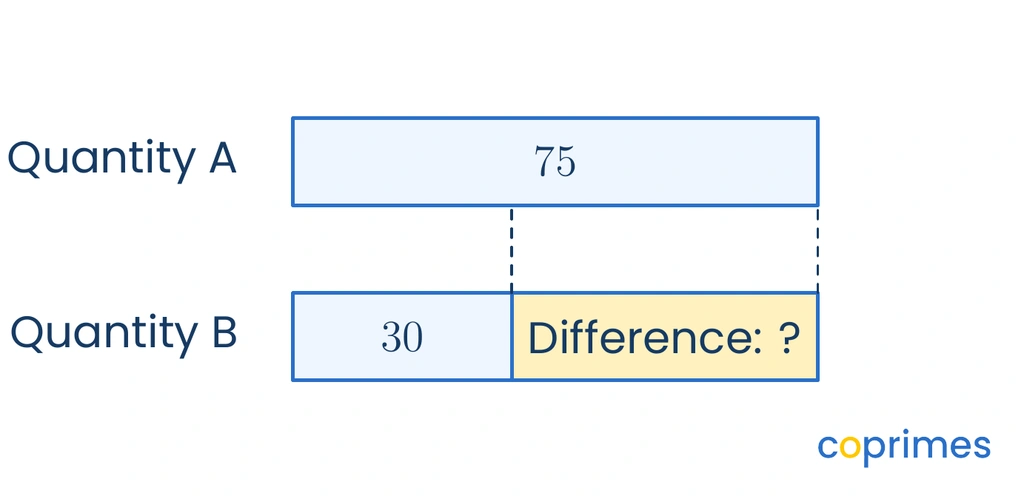
Comparison models are used when a problem compares two different quantities using phrases like "more than" or "fewer than."
This model places one bar directly below another. The difference in their lengths represents the extra amount by which one quantity is greater than the other. Aligning the left edges perfectly is essential for an accurate comparison.

Equal-groups models
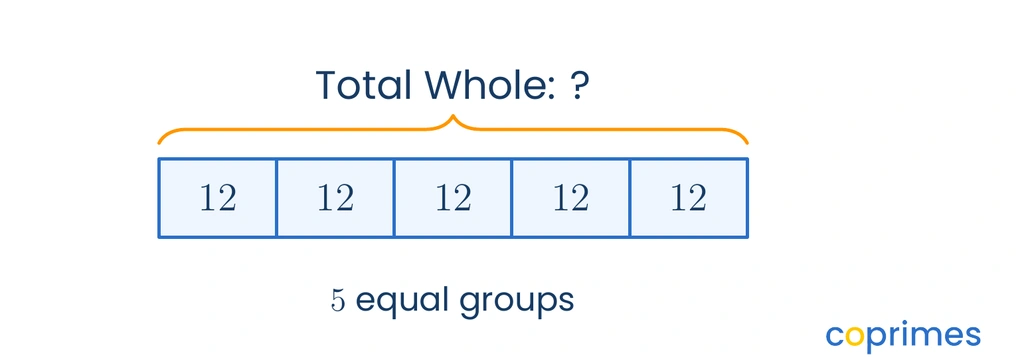
Equal-groups models represent multiplication and division. Instead of different-sized parts, the total whole is divided into several sections of the exact same size.
If you know the number of equal groups and the size of one group, you multiply to find the whole. If you know the whole and the number of groups, you divide to find the size of each group.
How to draw a bar model
Drawing an accurate diagram makes choosing operations in word problems much simpler.
Follow these standard steps:
- Identify the known values and the single unknown value you need to find.
- Choose the correct model structure based on whether parts combine, compare, or form equal groups.
- Draw the rectangular bars, making sure larger numbers receive visibly longer bars.
- Label every known bar and total with its number.
- Place a question mark in the spot representing the unknown value.
Worked examples
Using visual diagrams helps break down complex information, especially when organizing two-step word problems. For instance, many two-step addition and subtraction word problems require you to find a hidden total first before you can solve the final question.
Example 1: Finding a missing part
Question: A baker makes muffins. If are blueberry and the rest are bran, how many bran muffins did the baker make?
Method:
- Identify the whole ( muffins) and the known part ( blueberry muffins).
- The unknown part is the bran muffins.
- Because the whole and one part are known, subtract the known part from the whole.
- Calculate: .
Answer: The baker made bran muffins.
Check: Add the parts back together: . This matches the whole.
Example 2: Using an equal-groups model
Question: A teacher distributes markers equally among tables. How many markers does each table receive?
Method:
- Identify the whole ( markers) and the number of equal groups ( tables).
- The unknown is the size of each equal group.
- Divide the whole by the number of groups: .
Answer: Each table receives markers.
Check: Multiply the number of groups by the size of the group: .
Example 3: Solving a comparison problem
Question: Sarah has stamps. Liam has more stamps than Sarah. How many stamps does Liam have?
Method:
- Identify the base amount: Sarah has .
- Identify the difference: Liam has more.
- Liam's amount is the unknown total of Sarah's amount plus the difference.
- Add the base amount and the difference: .
Answer: Liam has stamps.
Check: Subtract to verify the difference: .
A learning plan shaped by your child, not the class
State-aligned Math plus our own Logic and English curriculum. An adaptive baseline test finds the gaps and fills them.
Common mistakes
A visual model only works well if it accurately reflects the mathematics.
Avoid these common errors:
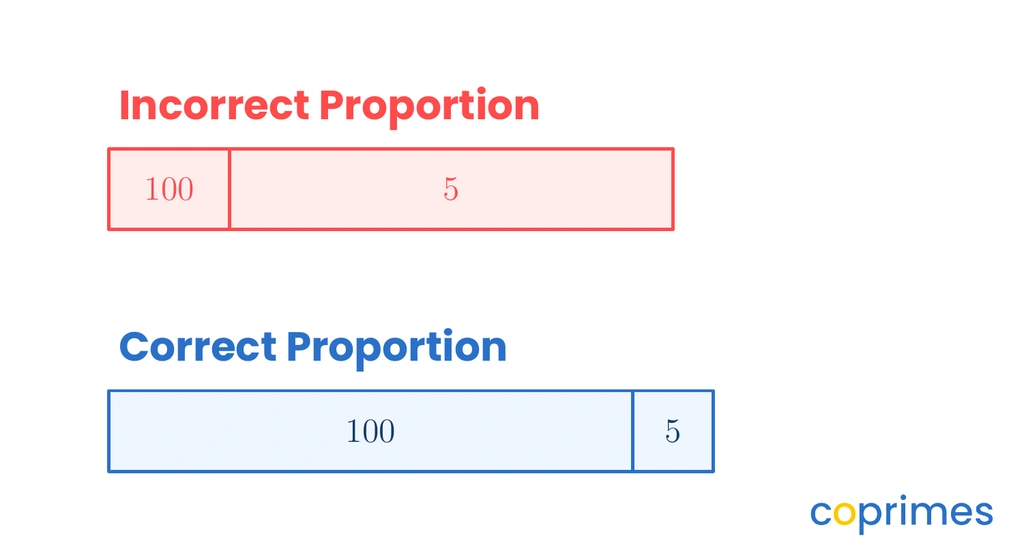
- Drawing disproportionate bars: A bar representing should be noticeably longer than a bar representing . If the sizes are skewed, the visual relationship becomes confusing.
- Misaligning comparison bars: When comparing two quantities, their left edges must start at the exact same vertical line.
- Forgetting the question mark: Always mark the unknown value clearly. Without the question mark, it is easy to solve for the wrong part of the problem.
Frequently asked questions
Why do bar models use different-sized boxes?
The size of each rectangular box visually represents the proportion of that number relative to the whole. A larger quantity receives a longer box, making it easier to estimate and understand the problem's scale.
How do bar models help solve math problems?
They turn abstract words into a concrete diagram. By seeing the parts and the whole mapped out, it becomes obvious whether addition, subtraction, multiplication, or division is the correct operation.
Can bar models represent fractions and decimals?
Yes. A bar can easily represent a whole of , which can then be sliced into equal fraction pieces or decimal segments. This is especially useful for visualizing equivalent fractions or percentages.
Practice questions
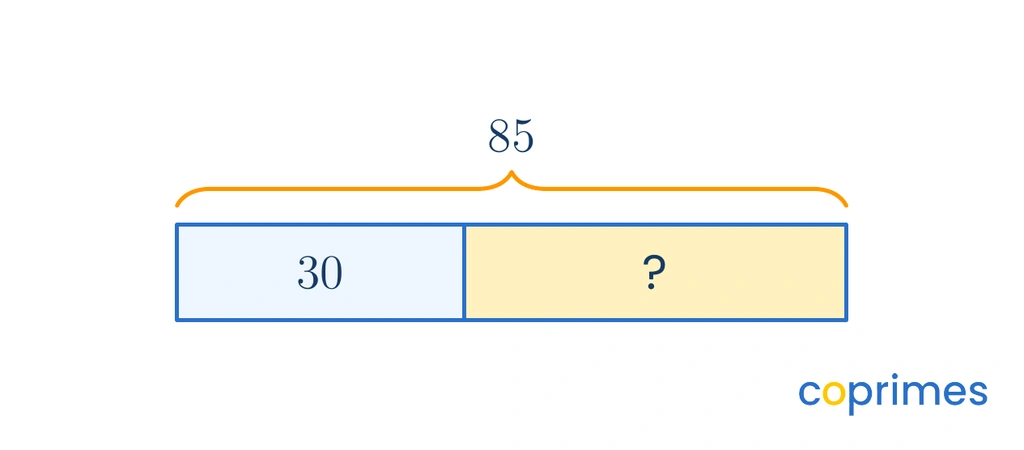
Which equation correctly represents the relationships in this bar model?
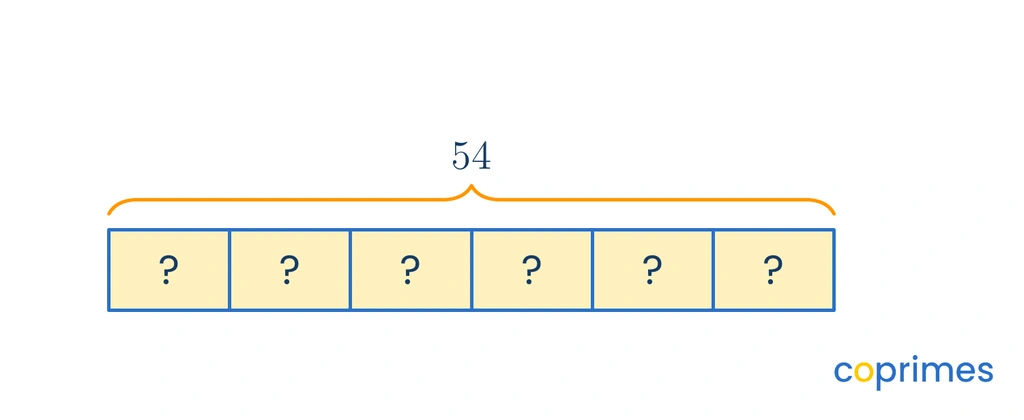
What is the value of the missing number in this model?
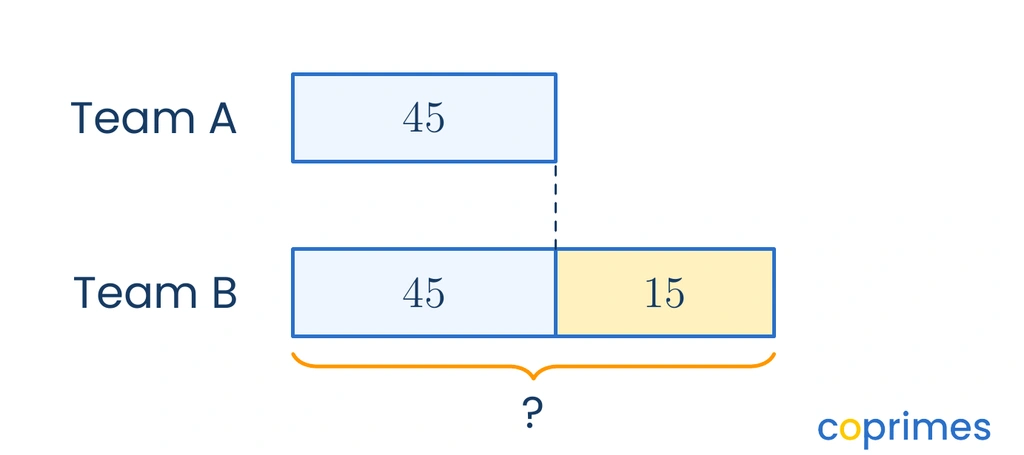
Based on the comparison model, what is the total amount for Team B?
A farmer has apples and packs them equally into boxes. Which model type best represents this problem?
A part-part-whole model showing addition.
A comparison model showing a difference of .
An equal-groups model showing division.
A comparison model showing multiplication.
An equal-groups model showing division.
A wire is centimeters long. It is cut into two pieces. If one piece is centimeters long, how long is the second piece?